About Me
I'm a musician, a performer, a songwriter and a Web Developer. I have been programming for 6 months, starting with JavaScript, HTML and CSS. I learned basic web development using jQuery, styling with CSS Flexbox, Bootstrap, and AJAX for asynchronous API interaction. My first full-stack application, I created a meme-generator using JavaScript, a Ruby on Rails framework and a PostgreSQL database. Becoming more comfortable in JavaScript, I also developed a matching app for dogs entirely in JS, using React for the front-end and an Express server using MongoDB.
React
JavaScript
HTML5
CSS
jQuery
Bootstrap
Ruby
Ruby on Rails
nodejs
Express
postgresql
MongoDB
AWS
Heroku
Git
Github
Portfolio
Recent Projects
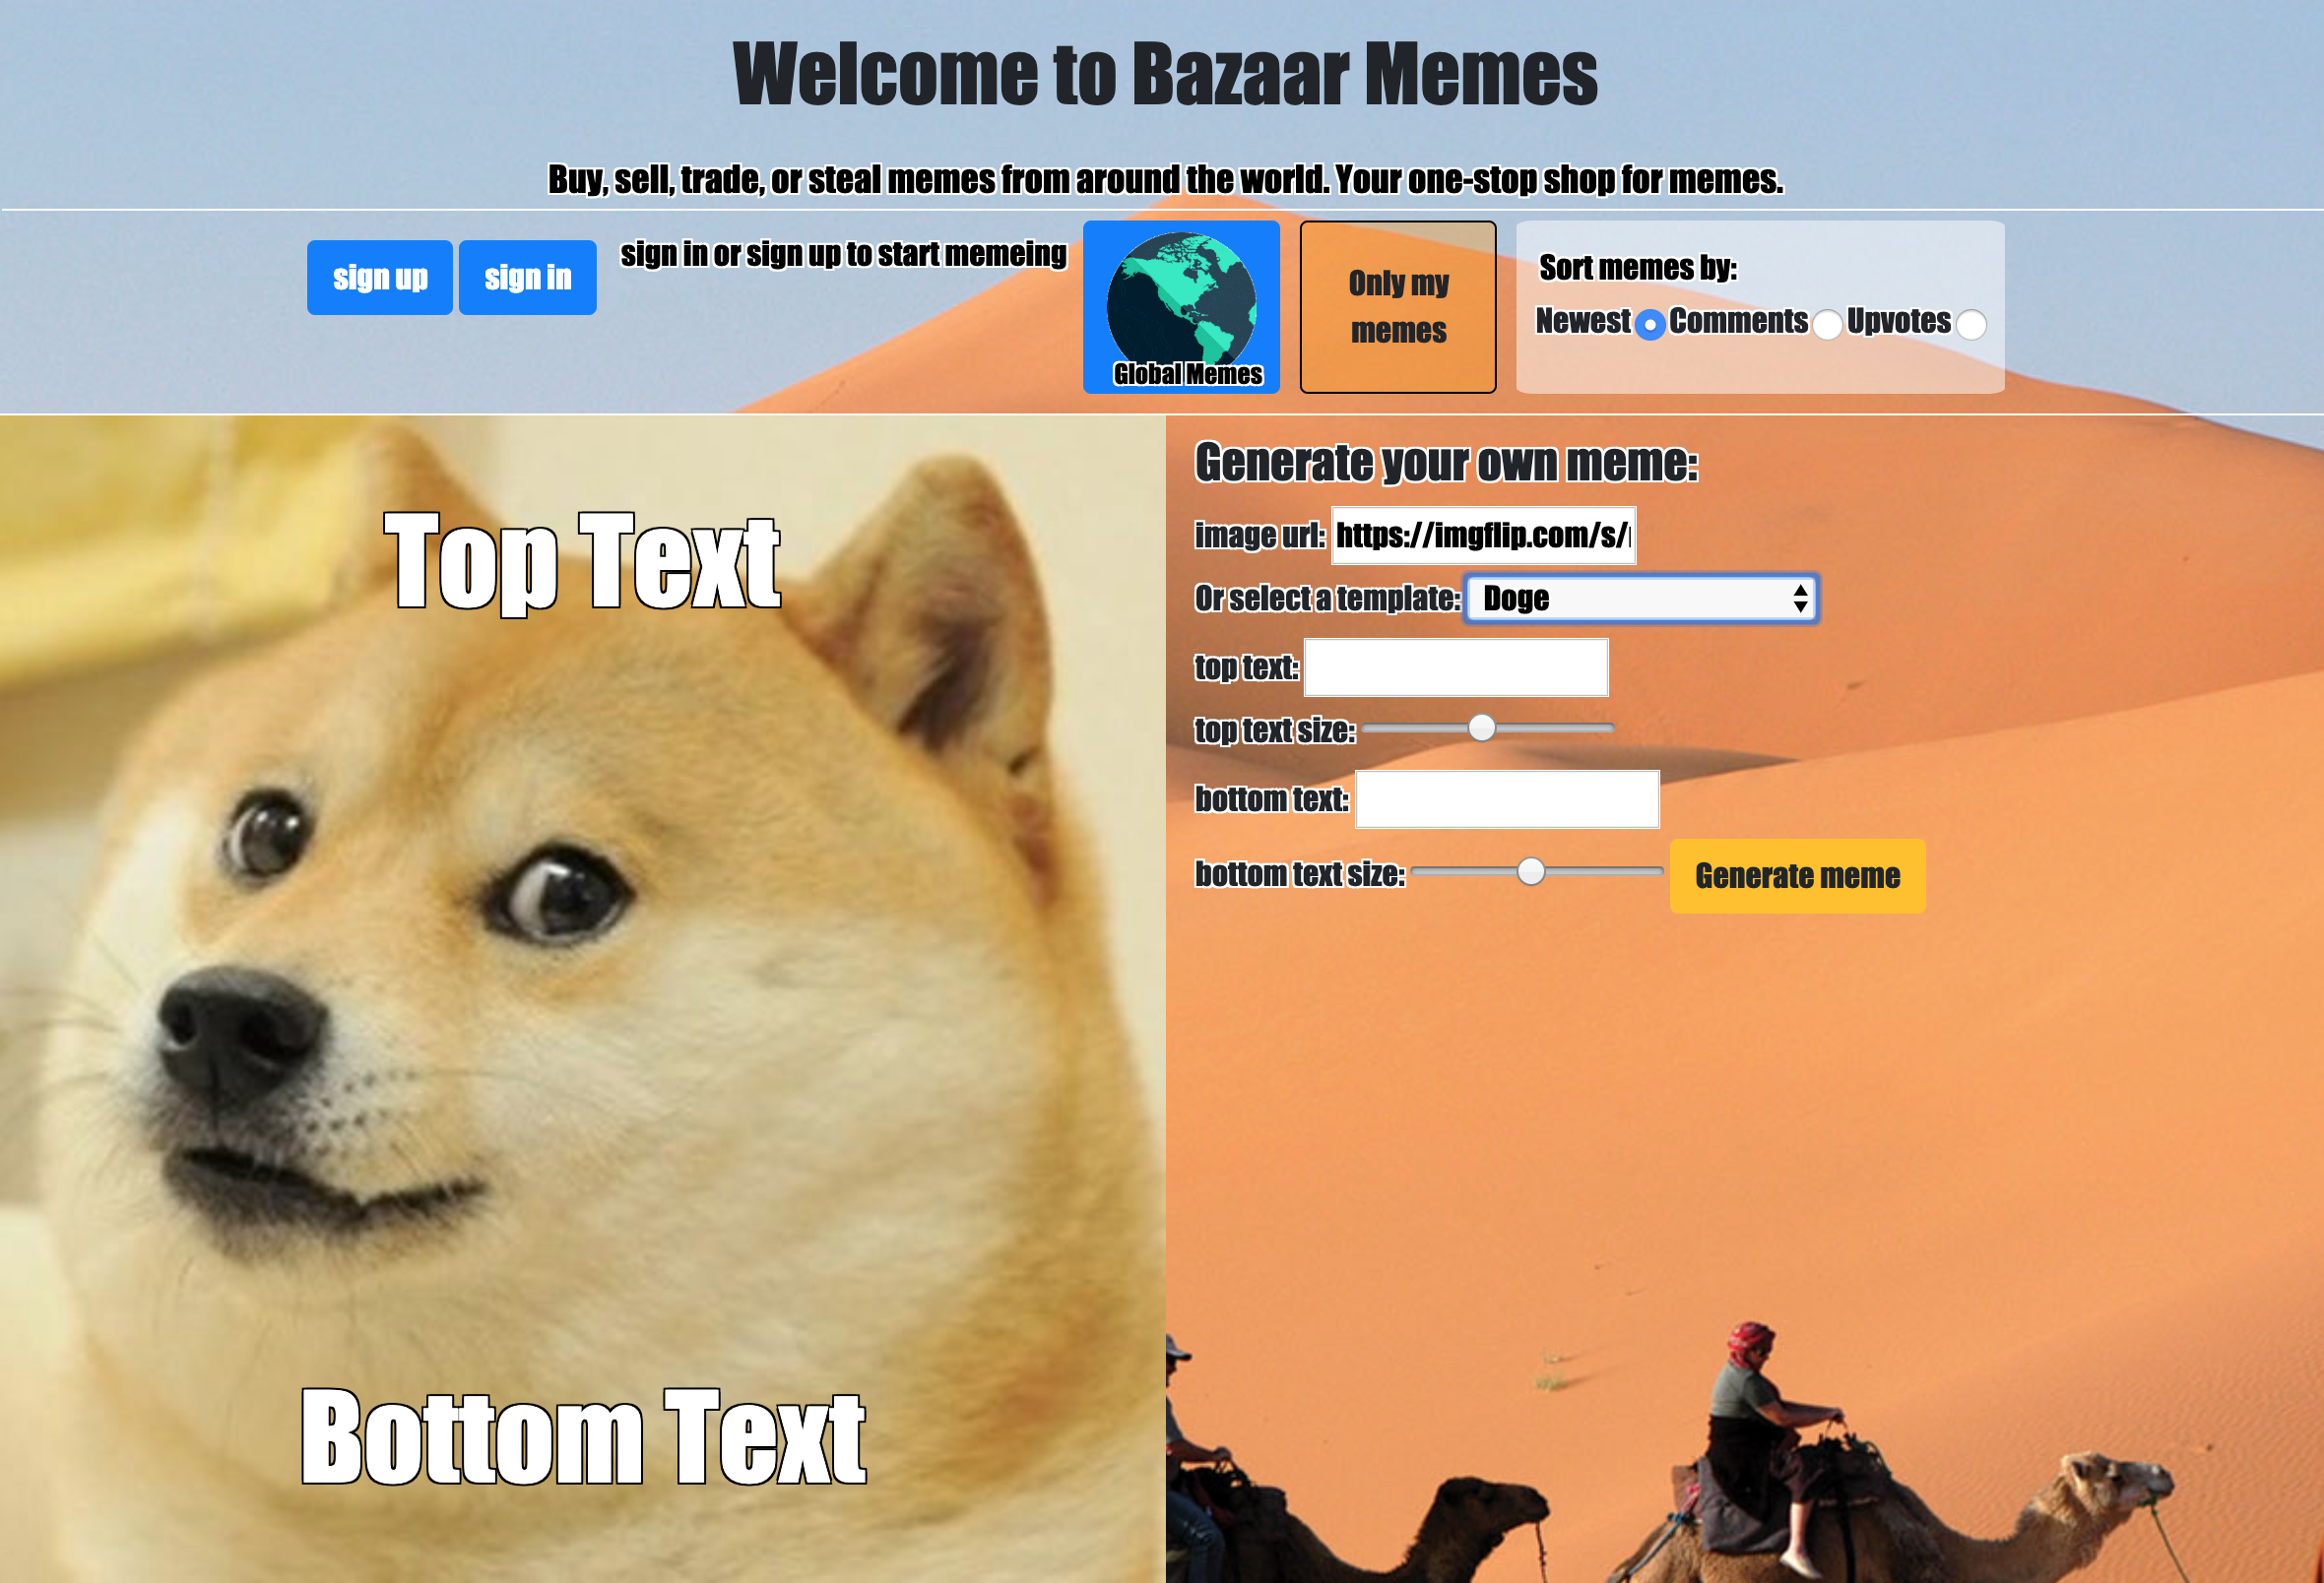
Bazaar Memes
Bazaar Memes is a full-stack web app with a front-end meme generator and back-end meme database. Store your memes in the global database and share them with users from around the world. Add comments and vote on the best memes. Also, looks great on a mobile device. Give it a try, with email: test@email.com, and password: test. Please allow up to 5-10 seconds for login

Wagger
Wagger is a full-stack web app built with React.js and Express/Mongoose/MongoDB. Users can sign up, create a dog profile, and match with other dogs in your area. Look through your matches and message them to arrange doggie playdates. Update every aspect of your profile to make sure you're always putting your best paw forward.

Let's Chat
Let's Chat is a full-stack web app built with Socket.io, jQuery, and handlebars. The backend also integrates Socket.io with a Node.JS Express server. Users can sign up, and chat in real-time with other users from potentially anywhere in the world. Real-time updates occur when another user is typing and when the chatroom receives a new message. Users can also update and delete their own messages if they made a typo or otherwise bad message. Updated messages are also updated for other users in real-time using Socket.io

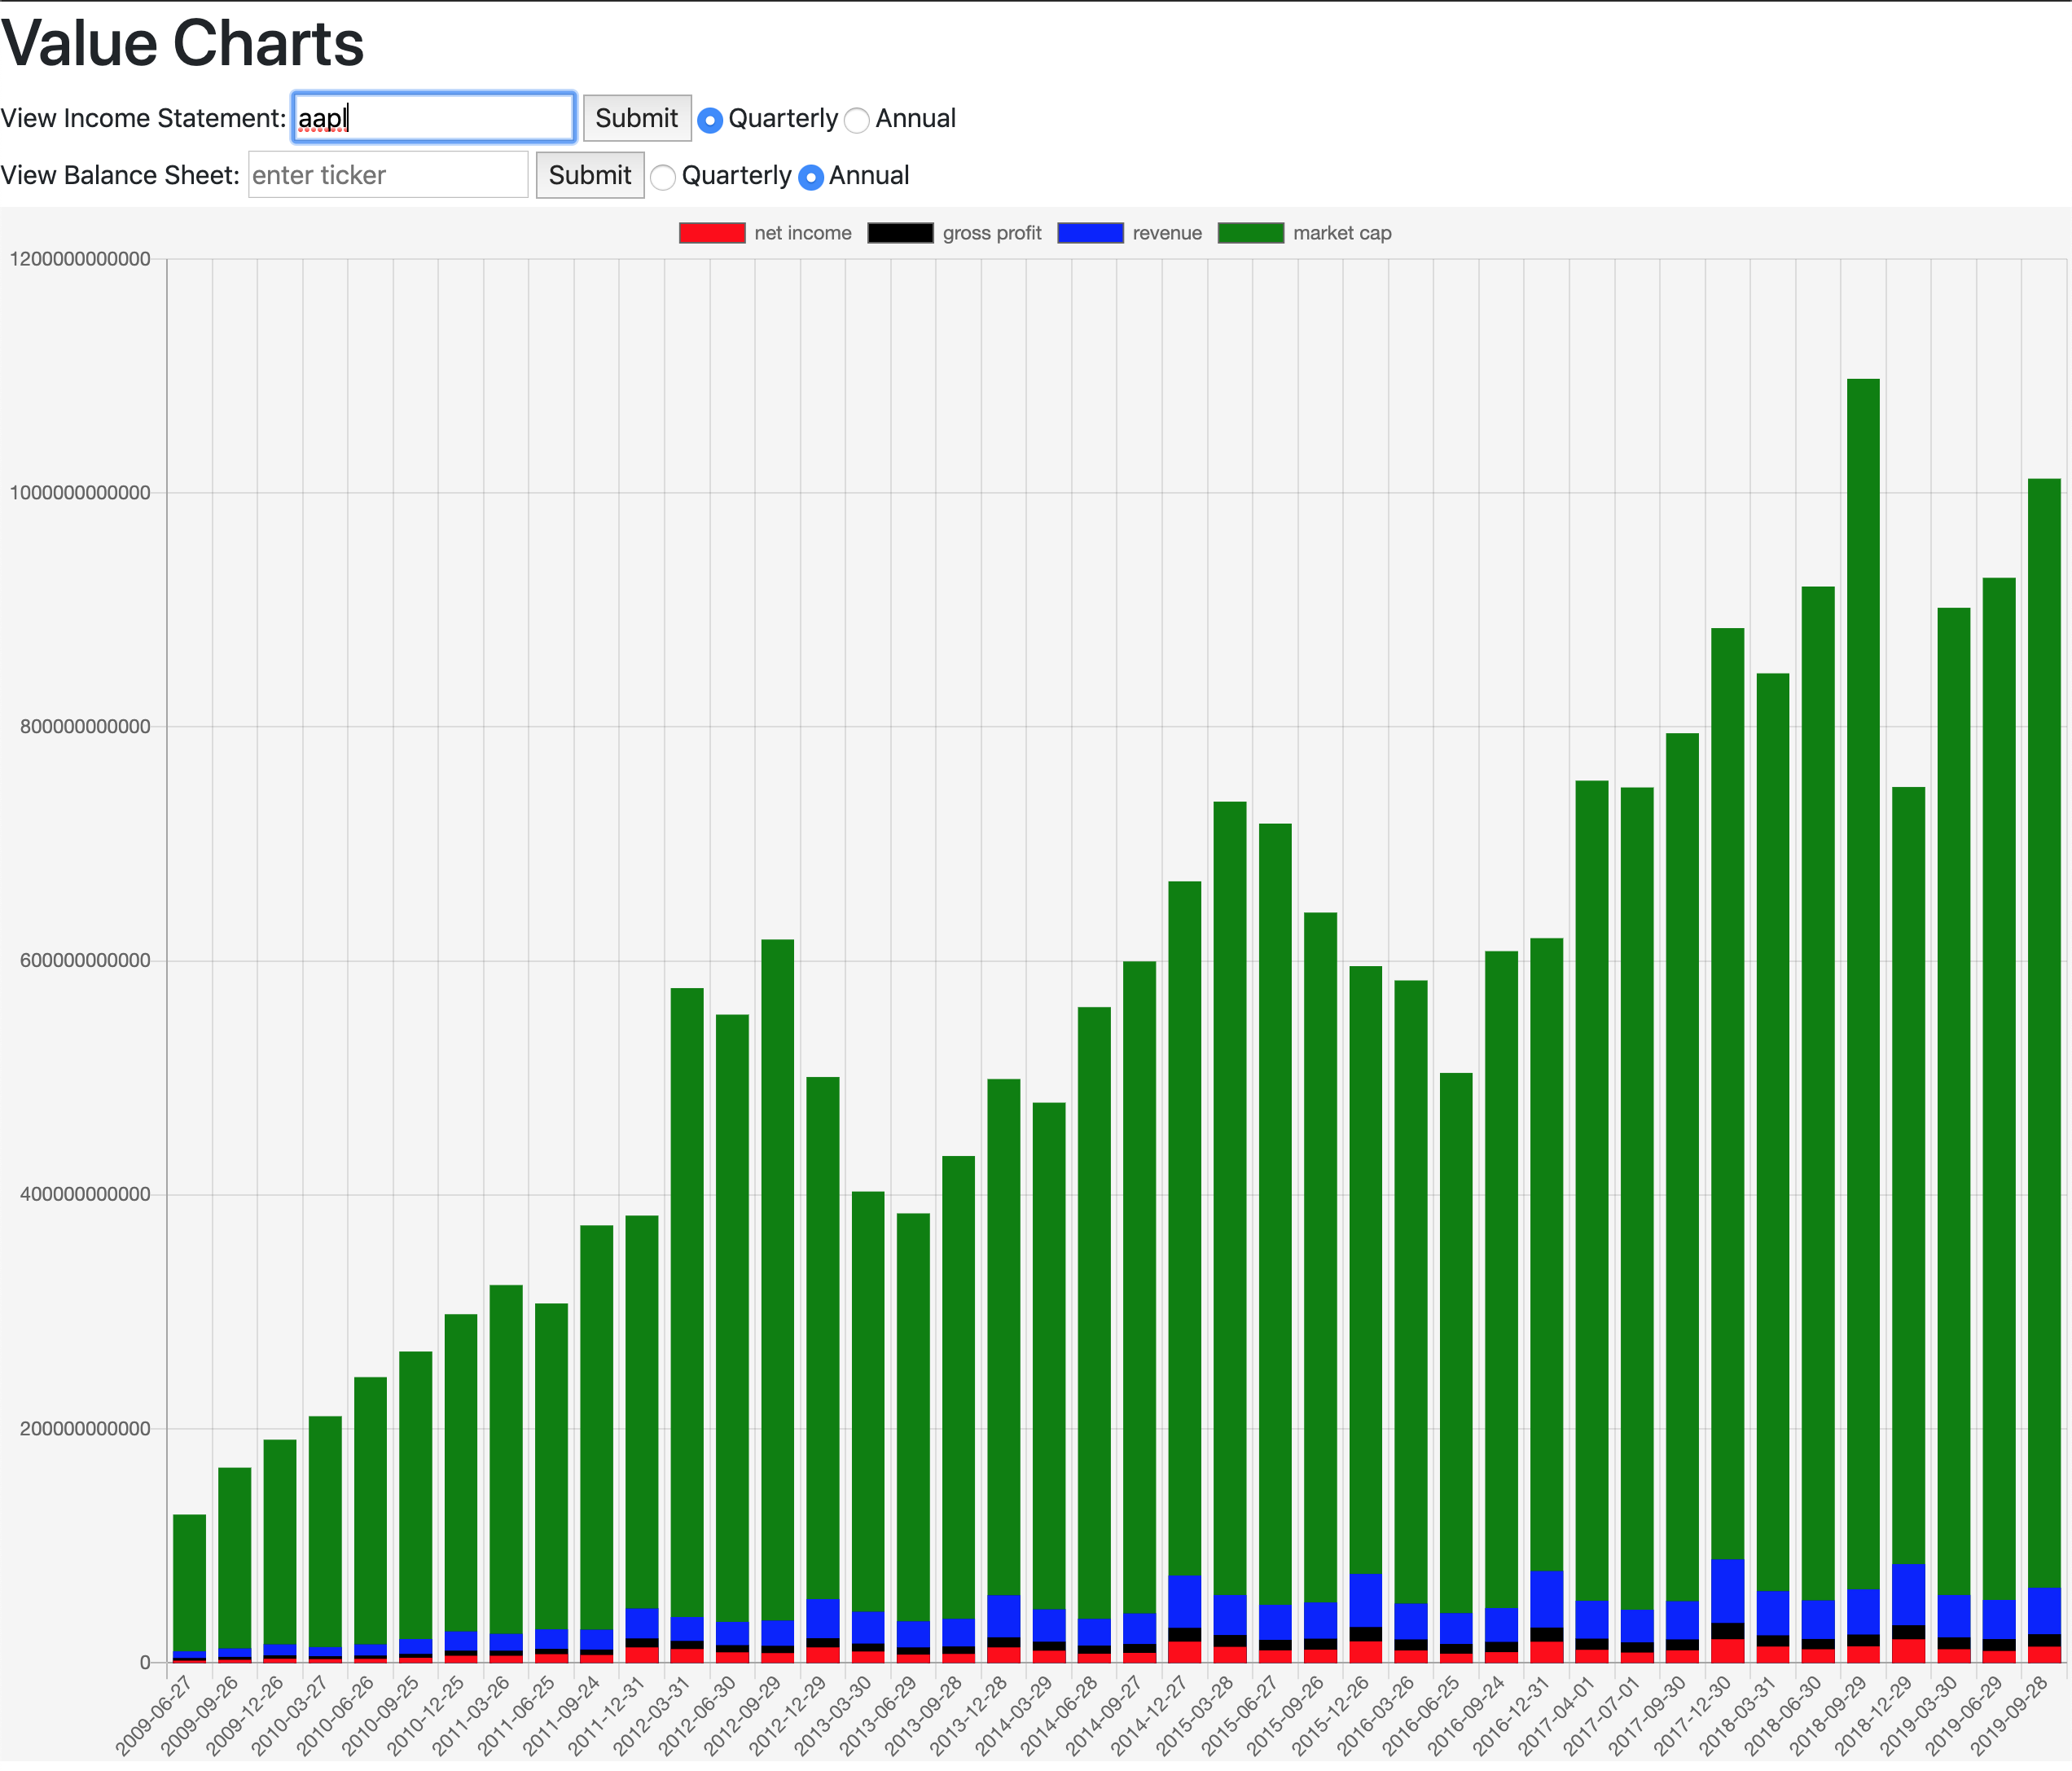
Value Charts
This front-end application uses an open-source third party api to obtain and display data on publicly traded company financials, using Chart.js. Simply enter a stock ticker and specify the time frame (quarterly or annual) and the app will display key information such as revenue, gross profit, and net income as compared to market capitalization. Users can also view balance sheet information to quickly visualize the financial strength of the company. In the age of Robinhood, and free stock trading, its now more important than ever to know what you are buying. Value Charts makes it easy to visualize financial data and combined with due dilligence and analysis of financial statements, helps users determine if they are buying a stock for a good value.

Contact
Get in touch
Phone
mobile: (860) 318-1324